Drawing a Wave
Here is the final code:
import processing.pdf.*;
float x, y;
float prevX=0.0, prevY=0.0;
float numOfWaves = 10;
float angle = 0;
float amplitude=1;
int cols = 7;
int rows = 1440;
float[][] myArray = new float[rows][cols];
void setup() {
noLoop();
beginRecord(PDF, "filename.pdf");
for (int i =0; i < cols; i++) {
for (int j = 0; j < rows; j++) {
myArray[j][i] = random(0, height/16);
}
}
size(1440, 720);
background(0);
stroke(255);
}
void draw()
{
for (int i=0; i < 7; i++) {
translate(0, height/8);
float frequence;
float minRange = 0.8;
float maxRange = 4;
switch (i) {
case 0 :
frequence = map(60.0, 0.0, 4000.0, minRange, maxRange);
break;
case 1 :
frequence = map(120.0, 0.0, 4000.0, minRange, maxRange);
break;
case 2 :
frequence = map(240, 0.0, 4000.0, minRange, maxRange);
break;
case 3 :
frequence = map(480, 0.0, 4000.0, minRange, maxRange);
break;
case 4 :
frequence = map(960, 0.0, 4000.0, minRange, maxRange);
break;
case 5 :
frequence = map(1920, 0.0, 4000.0, minRange, maxRange);
break;
default :
frequence = map(3840, 0.0, 4000.0, minRange, maxRange);
}
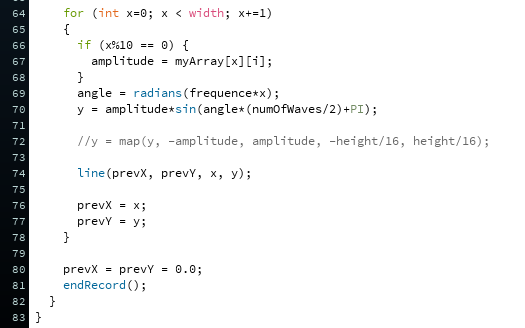
for (int x=0; x < width; x+=1)
{
if (x%10 == 0) {
amplitude = myArray[x][i];
}
angle = radians(frequence*x);
y = amplitude*sin(angle*(numOfWaves/2)+PI);
//y = map(y, -amplitude, amplitude, -height/16, height/16);
line(prevX, prevY, x, y);
prevX = x;
prevY = y;
}
prevX = prevY = 0.0;
endRecord();
}
}
Drawing my wave was not so easy to do, first thing I did is I made my setup with simple demand like the size and the color of my background.
Then I set the color of my stroke. Easy peasy.
size(1440, 720);
background(0);
stroke(255);

Then I declare two integer variable at the top of my code, one for my colonnes, the other one for my rows. Since I have 7 frequency I want to use for my draw, I set the variable column equal to 7. Also I want to record every x position on my wave so I set the number of rows equal to the with of my
page, 1440.

Back to my setup, I made a for loop that ask to my program to see if there's is less then 7 column and less then 1440 rows, if it's true, always add one till it's false.

Then I created an Array that goes into my for loops and calls my colums and rows, but since I still don't have any input nor data to fill my rows in each columns, I give them a random value using the random function and space them between 0 and the height of my windows/16, why 16 you ask? because we have 7 columns + 1 for spacing and we muliply it by two to create an equal spacing between each column.

I also called the beginRecord function and store it into a PDF file call filename.pdf this will be store in my processing folder.
Next, I have to position my arrays on my page so they don't spawn all one on top of the others. To do so I use the Translate function and simple position them at my position x0 and y equivalent to the height of my draw / 8, for each spacing I want in My draw.

Now I had to map my data in such a way that the draw looks like a fine result. without mapping, the waves of my draw would look way to big and disproportionate for the size of my artboard. the map function is pretty simple to use, in your condition you first have to set the incoming value to be converted, then the lower and upper bond of the value current range followed by the target lower and upper value range. I did a mapping for each of my rows.

Next, the code get a little bit more complex.
 "
"
Here we basicly said that x equal 0 and as long as it's not bigger than the witdh of the draw, we will incremente by one.
for (int x=0; x < width; x+=1)
angle = radians (frequence*x)
This line is use to draw the actual angle of our next point, we multiply the the frequency with our x data so the bigger the frequency th more cycle we will draw.
Finally we draw a line between the last and the new coordinates, and reste the coordinate at 0.
Here is the result!

You can see that since were using random data, the result is never the same!

This code will be extremly useful for my final project. I will have to read from a serial input instead of generating random values, but for the rest everything is done to draw my sound!